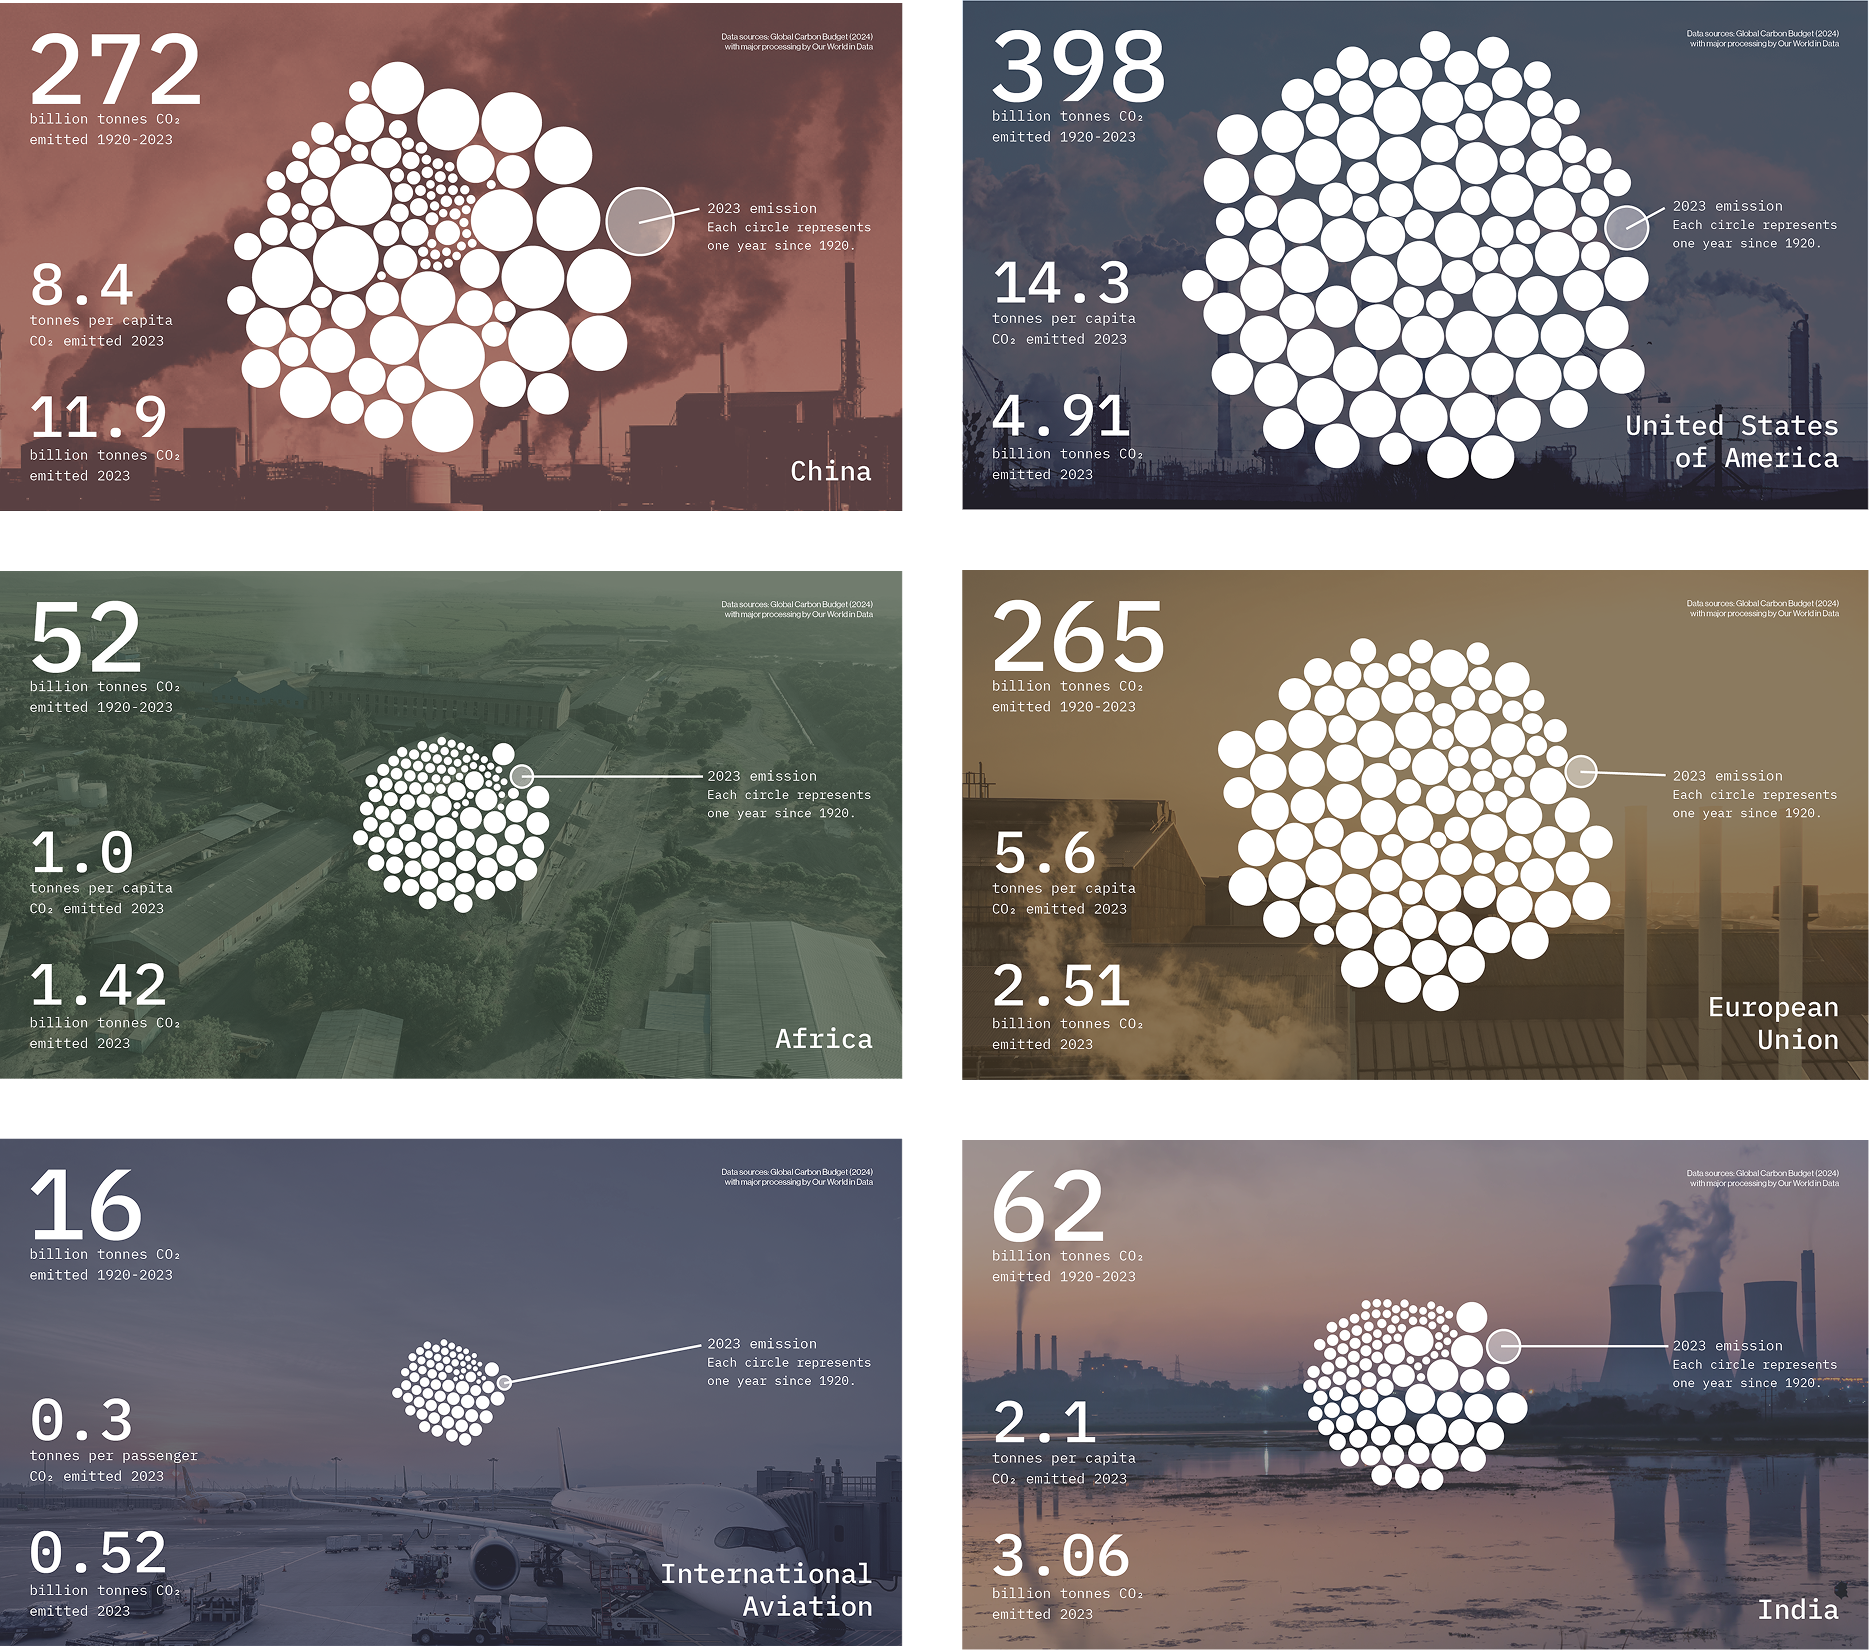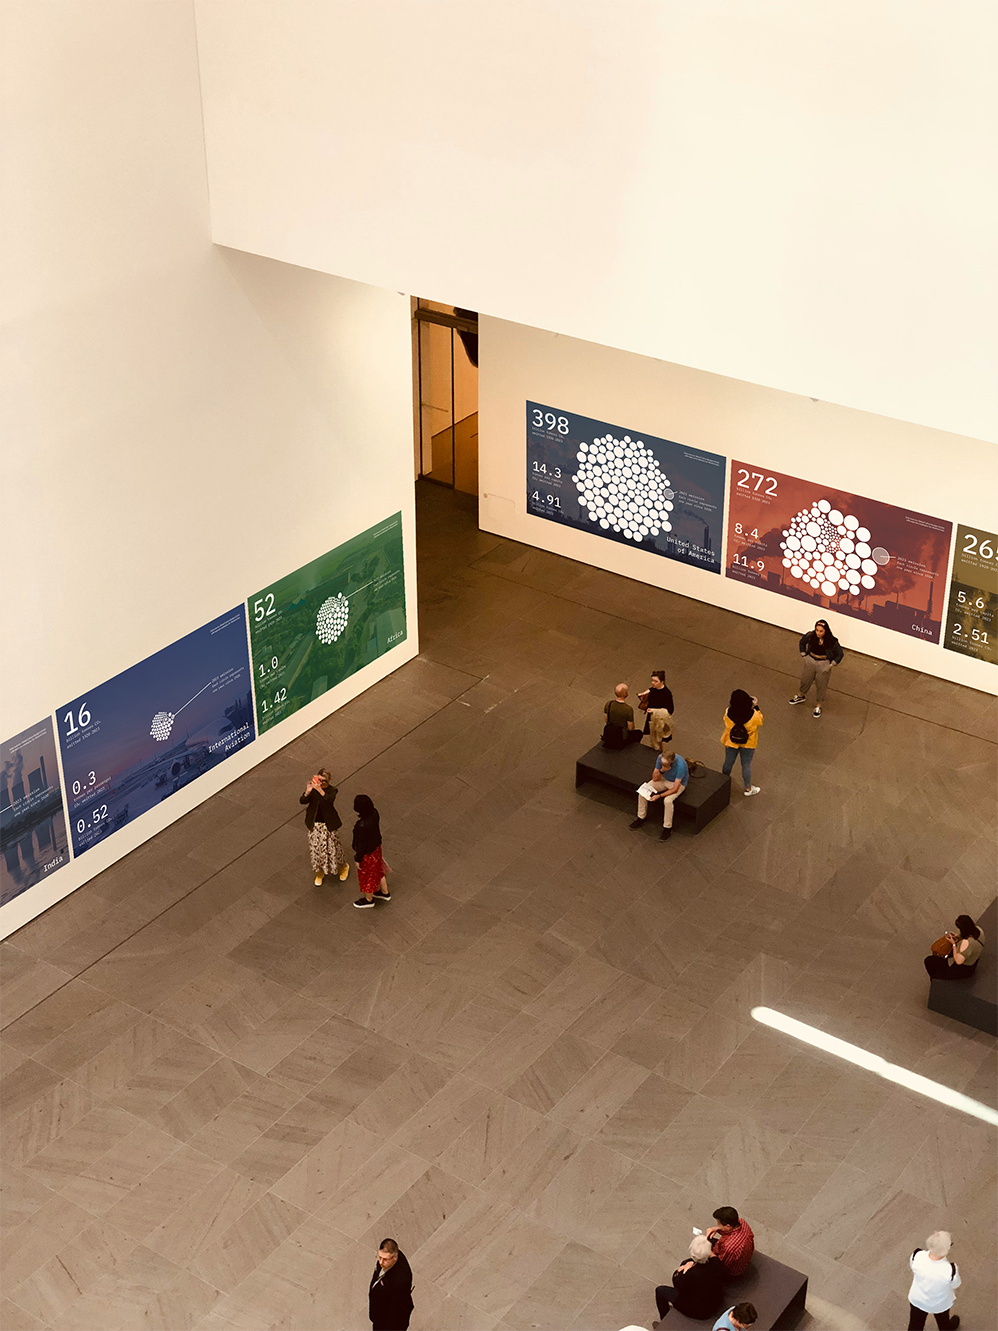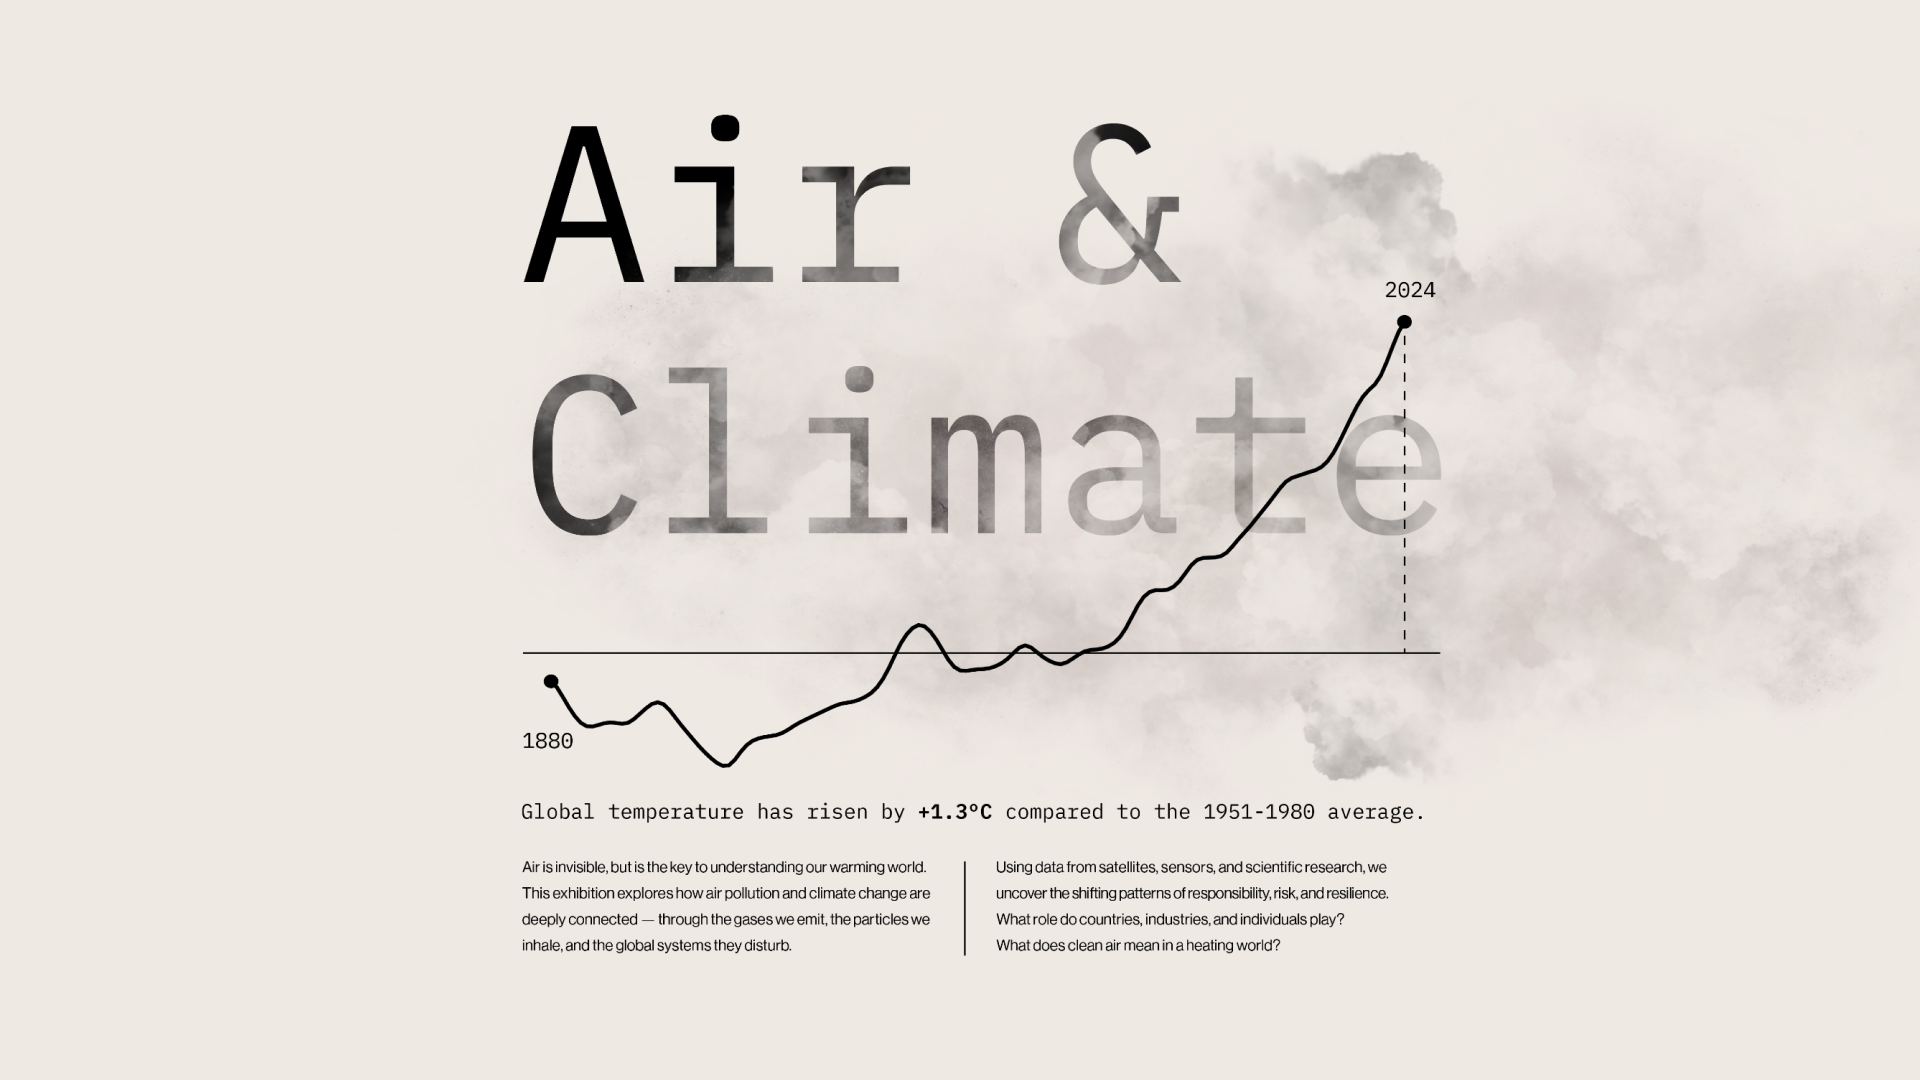
This project explores the intersection of air quality and climate change through an editorial-style data visualisation system. Drawing on global emissions and air pollution metrics, it presents a scalable, flexible graphic language designed for public engagement and exhibition environments.
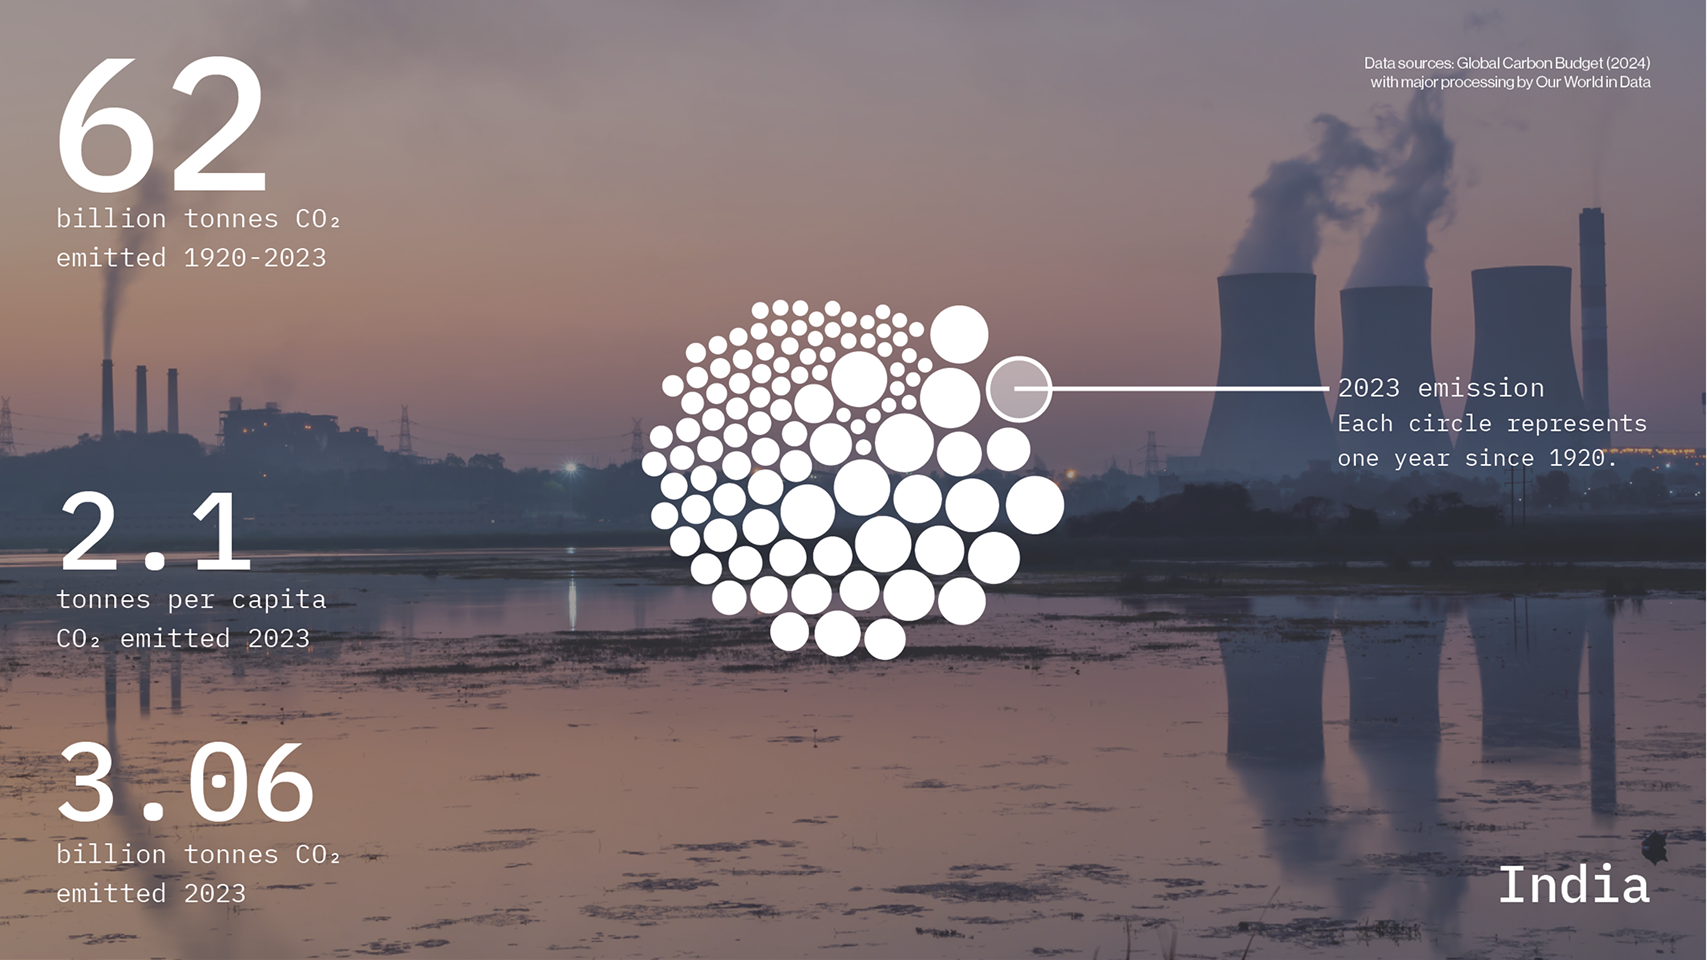
Using bubble clusters to show the relative burden of emissions across regions, the system overlays data on contextual photography to create a sense of place and urgency.